A thoughtful question was asked after I wrote the article on largemouth bass replacing smallmouth bass in a South Dakota pond that we manage. Dick Faurot of Bixby, Oklahoma asked "In the article Largemouths and Smallmouths in the Same Pond?, Dave Willis notes that over a 10 year period the introduction of largemouth bass totally eliminated the smallmouth from a gravel pit pond. I understand that largemouth are more dominant in a small fishery such as a pond, but what I don't understand is what happened to the biggest smallmouth that were initially there. I find it hard to believe that they were also eaten by the largemouth. A size distribution of the smallmouth prior to the introduction of largemouth was not given in the article but given the age of the pond I would assume there were at least some smallmouth in the 14-20 inch range. Granted a largemouth can eat something up to half its body length, but that would still leave the biggest smallies.....so, what happened to them?"
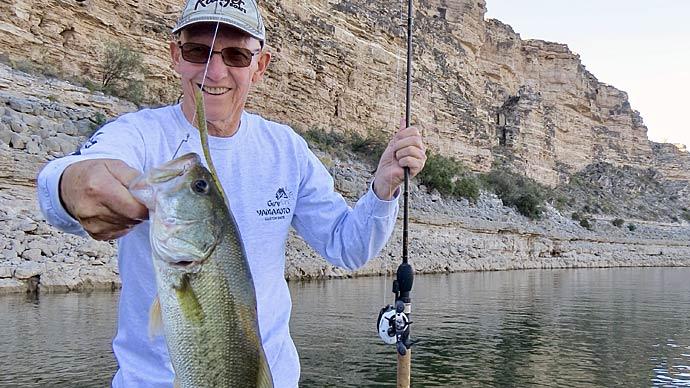
Great question, Dick! I think the answer is pretty straight-forward. The adult smallmouth bass gradually disappeared through natural mortality. I'm sure that few smallmouths make it past 6 or 8 years of age up here, and a 10 would be an OLD fish. So, they just gradually faded from the fish community. The pond owner does not harvest any smallmouth bass, so I suspect that his smallmouth bass population probably experienced somewhere near 30-40% mortality per year. That would be a typical mortality rate for this fish species in this geographic location.
So, Dick's question led me to the thought that perhaps I could provide a fish biology lecture on mortality rates. Whether fish are harvested from a water body or not, all fish populations will exhibit a typical total annual mortality rate. A certain percentage will die each year regardless of whether any were harvested by anglers. I frequently hear the following. "I stocked 100 8-inch walleyes in my pond 5 years ago. Why can't I catch and harvest those 100 fish now that they average 20 inches each?" Well, they just aren't there.
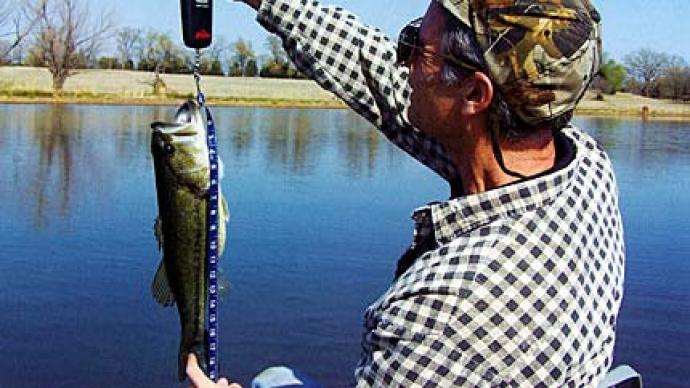
Take a look at the charts. Let's assume that you have a largemouth bass population in a South Dakota pond that experiences 30% total annual mortality (top figure). That means 30% will die each year regardless of whether they are harvested or not. If you start with 100 largemouth bass at age 1, by the time they reach age 5 there will only be 24 left. In contrast, let's say you have 100 age-1 black crappies in a southern U.S. reservoir. They have a total annual mortality rate of 70%. In this case, you should expect only 1 of those 100 crappies to still be alive at age 5. See the huge effect that different mortality rates have on those two different populations?
So, why do different populations have different mortality rates? Well, most often the rates depend on the species of fish and the geographic location. Some of the panfish, such as crappies or yellow perch, tend to be shorter-lived than some of the predators such as walleye or largemouth bass. Grass carp tend to be long-lived. I recall one study in Iowa where they had only about 7% total annual mortality! That leads to some pretty old fish.
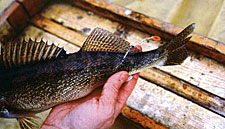
In general, fishery biologists expect to see shorter-lived fish at southern latitudes and longer-lived fish at northern latitudes. This is a general rule, and you can always find exceptions, of course. However, let's take walleyes as an example. In northern Canada, total annual mortality rates may only be 10% per year and fish may live to age 20. Contrast that with Oklahoma or Kansas reservoirs, where the total annual mortality may be 40-45%! Why the big difference? Well, much apparently has to do with growth rates. In northern Canada, walleyes may only grow an inch a year. In those circumstances, they tend to live much longer. In a Kansas reservoir, an age-3 walleye typically is 18 inches long! When growth is that fast, then mortality rates are much higher.

So, how do we find out how much of the total mortality rate is from fishing (angler harvest) and how much is natural? Well, first of all, if there is no harvest, then all mortality must be natural. For sport fisheries, management biologists typically try to determine fishing mortality (harvest rate), also termed exploitation. We do this most often with tagging studies. Perhaps you've caught a fish that had a brightly colored, numbered tag inserted behind the fin on the back. Sometimes agencies will offer rewards or enter you in a prize drawing if you turn in the tag. The purpose of these efforts is to determine what percentage of a population is being harvested. If a biologist knows that a bluegill population in a southern Iowa impoundment has 50% total annual mortality, and exploitation is 20% for the year, then 30% of the mortality was from natural causes.
What the heck are "natural causes?" Well, the list typically includes things such as diseases, parasites, predation by other fishes, predation by birds such as cormorants, old age (senescence), etc. Why the heck don't we see all these dead fish? Well, it's most often a gradual process. A fish dying here or there might or might not be noticed. Most sink, and if they float, they may only be on the surface for a short time. Also, many scavengers (turtles, raccoons, etc.) are happy to help clean up for you.
Class dismissed!
Dr. David W. Willis is a professor in the Department of Wildlife and Fisheries Sciences, South Dakota State University in Brookings. He frequents the Pond Boss forum at www.pondboss.com and can be reached there.
Reprinted with permission from Pond Boss Magazine


