In our last article, I reviewed the scientific debate on "attraction vs. production" as related to fish habitat. We concluded that adding habitat can attract fish, and if done at high enough levels can increase production offish (abundance or growth). We revised our research question to "How much habitat do you need to add in order to increase production of largemouth bass, either in terms of abundance or growth?" We left off with a new idea that adding habitat may increase productivity by re-plumbing the food web. To understand this idea, we first need to dig a little deeper into the concept of productivity.
There are at least three ways that habitat increases the productivity of a lake.
- Bottom-up: Adding habitat supplements the nutrients at the base of the food web. The decomposing brush piles, lay-down logs, etc., release nutrients (think fertilizer) like nitrogen, phosphorus, and carbon, which algae and plants need, and that in turn feeds invertebrates, prey fish, and finally, further up the food chain, Largemouth Bass.
- Juvenile survival: Structural habitat increases survival of young fishes by increasing refuge areas. Productivity in this case is increased abundance of fish because of increased survival at younger ages (recruitment).
- Top-down: Structural habitat increases predation efficiency of top carnivores, like Largemouth Bass, on prey fishes.
This is what we call Re-plumbing the Food Web.
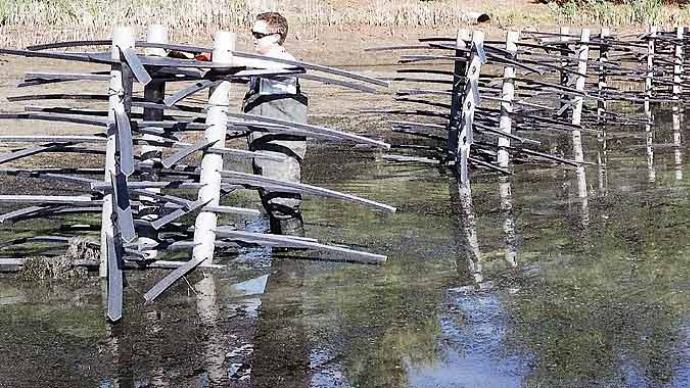
Our study lake received extensive management to support and enhance prey fish availability. Populations of bluegill, gizzard shad, threadfin shad, and tilapia are maintained at high abundance through feeding and stocking. Despite a smorgasbord of prey fish offerings, Largemouth Bass diets were generally dominated by crayfish. Now, crayfish provide adequate nutrition for small and medium sized Largemouth Bass, but in order to grow small and medium sized bass into trophies, the bass need to shift their diet from crayfish to finfish.
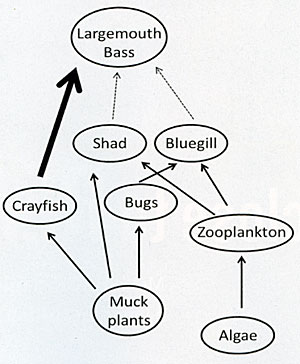
Refer to the above figure to follow our logic. Most of the energy (represented by the biggest, thickest arrow) that ended up in Largemouth Bass came from crayfish, whereas little energy (represented by the smallest, thinnest arrows) was contributed by shad and Bluegill. After pondering the below food web, we started describing the energy in shad and Bluegill as leaking, as opposed to getting piped into Largemouth Bass.
What does this leaky food web have to do with habitat? To understand this question we have to understand the ecology of Largemouth Bass. We started off by thinking of Largemouth Bass as ambush predators. When we originally presented our habitat research ideas at the last Pond Boss conference in February 2015, Ralph Manns, long time biologist and contributor to In Fisherman magazine, was in the audience and quickly corrected our thinking. He pointed out that Largemouth Bass are generalist predators with a range of feeding behaviors—ambush, stalking, hovering, and active feeding. Most of these behaviors, with the exception of off-shore schooling, generally occur in and around habitat features. In fact, they often move into heavy cover to flush prey. Thus, Largemouth Bass are generalist predators that relate to structural habitat.
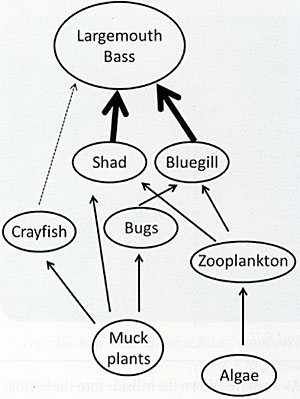
Now for the re-plumbing. Because of attentive management, we knew that there were plenty of prey fish available to Largemouth Bass. Our challenge was to fix the leak and shunt more shad and Bluegill into Largemouth Bass. We hypothesized that lack of structural habitat was causing the leak in the Grand Lake food web. Largemouth Bass were spending too much energy swimming through the lake searching for shad and Bluegill, having low feeding efficiency. We predicted that if we added structural habitat to the lake, then Bass feeding efficiency on shad and Bluegill would improve. Why? In my last column, I described our Fish City concept. By stationing Fish Cities around the littoral zone of the lake, we anticipated that individual Bass would establish territories around particular cities—no more exhausting roving! Furthermore, prey fish would use the Fish Cities for refuge, increasing juvenile survival, and perhaps more importantly, more frequently falling victim to Largemouth Bass predation. We know Bluegill establish territories for spawning, such that the largest, most dominant Bluegills establish their nests near the center of the colony. It follows then that the most dominant Bluegills in Grand Lake would establish the safest refuges near the centers of the Fish Cities, whereas others would be on the periphery and more vulnerable to Bass predation. This same strategy pops up in lots of other interactions in the animal kingdom: older, weaker elk are forced to the edges of the herd, where they are more vulnerable to wolf predation. See the figure to the right for an illustration of Re-plumbing the Food Web.
The "Re-plumbed" Grand Lake food web. We predict that habitat will allow Largemouth Bass to more efficiently feed on shad and Bluegill.
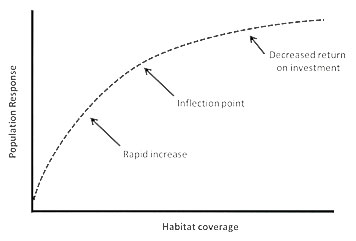
Re-plumbing the food web gives us a mechanism to explain how habitat affects Largemouth Bass. Now we need to circle back to our research question "How much habitat do we need to increase the growth of adult Largemouth Bass?" We read lots of scientific studies, we talked with lots of different biologists, scientists, and anybody else that would listen. We then arrived at the following framework: the Habitat Curve. This means we think fish populations respond to habitat addition in a predictable way.
The habitat curve has some interesting properties. First of all, the y-axis can represent several components related to fish life history. For example, you can focus on spawning habitat coverage (availability of appropriate substrate and depth) and measure response in terms of production of age-0 Largemouth Bass. We also could quantify the availability of refuge habitat (shallow areas with dense structure or macrophytes) and measure the response in recruitment (survival to age-1). The second interesting property is the shape of the curve. At low levels of habitat additions, we predict a rapid increase in the population response. The inflection point also is very important. Below the inflection point, you get an ever-increasing return on habitat investment, and beyond the inflection point the return diminishes. At progressively higher levels of habitat coverage we predict ever smaller population responses. We even have some suggestions that at very high habitat coverage, the population response can begin to decline (like a dome-shaped relationship). If our data eventually support the curve, this tool will provide predictive targets for habitat management.
The next step was to put some numbers on the graph and conduct field experiments to test our ideas. We are about halfway through that process and already have some positive results. And, that is the story for next time.
Reprinted with permission from Pond Boss Magazine