There's something to be said about old paper maps, and they hold some nostalgia when looking over them. But, in today's modern era of bass fishing, electronic charts have become the go-to for their ease of use, convenience, and ability to hold loads of data about your favorite water bodies.
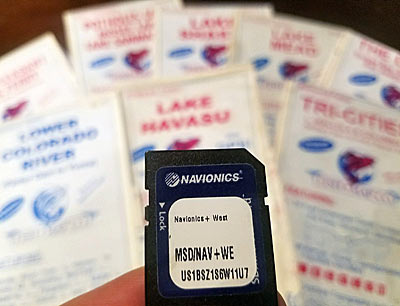
Electronic mapping makes it easy to find good fishing locations, and it is right there in front of you on your marine electronics. Instead of carrying maps for each lake, you can see every water body in a region on a simple SD card.
The various mapping cards on the market are powerful tools for locating new fishing spots once you know how to get the most out of them. Here are some tips to help you quickly learn to analyze the water with electronic mapping.
The Basics
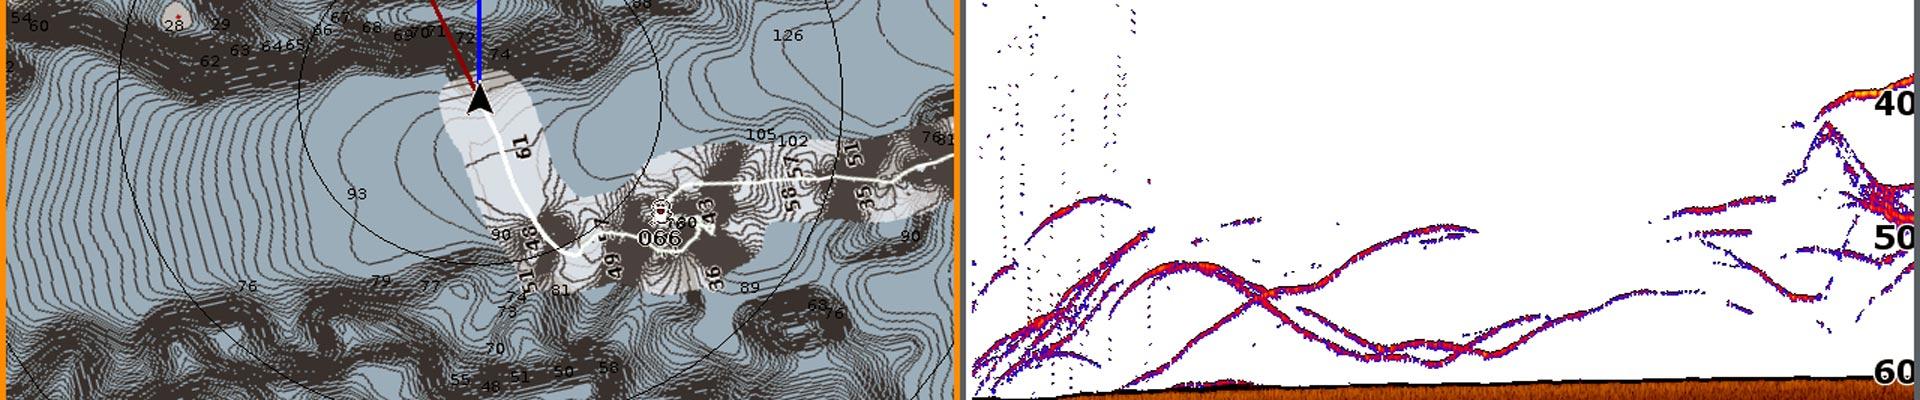
Some general things remain the same, whether looking at a stained and wrinkled paper or map or viewing a map on the latest and greatest chartplotter: contours.
Simply put, they are the changes in the bottom shown on the maps and offer many different clues to where bass will be relating. It could be a sudden depth change, flat that bass use to spawn, or a creek channel showing their migration routes in search of forage.
Learning to read contour lines is an essential tool in a bass angler's knowledge base and will speed up the process of finding fish and make you more efficient on the water.
Some of the most important things to look for are irregularities in the contours. These show some change happening beneath the water's surface, acting as magnets to bass during different seasonal movements. Locating precisely where that hump comes up or how far out a point goes into the water will often point you towards fish.
The General Rules
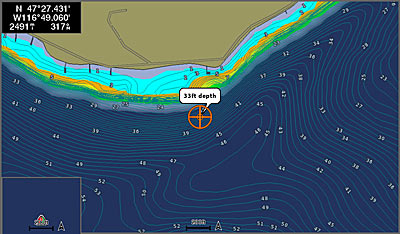
When reading a map, looking at contour lines is the first step, and some general rules will help you better understand what is beneath the surface.
The space between two contour lines is the biggest clue to the slope on the bottom. The closer the lines are, the steeper the drop into deeper water. On the other hand, flats are shown with more space between lines, indicating the same depth for extended periods. Today's electronic maps have high-definition contours showing one-foot changes and allowing you to see even the subtlest depth changes.
Once you have become comfortable with reading contours, some tricks will help you maximize your electronic charts.
Adjusting Fishing Ranges
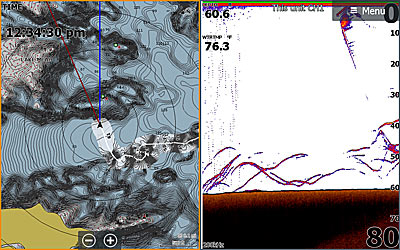
One simple tool to make things stand out easier is using different colors to denote different depth ranges. Chartplotters vary significantly by brand and model and what is capable with electronic mapping. However, setting different colors to show different depth ranges can be done in some fashion on all major brands.
Currently, three major electronics brands (Garmin, Lowrance, and Humminbird) allow this with their electronic mapping brands. Navionics Boating app users can also utilize this feature on mobile devices and tablets.
The benefit of doing this is finding the depth ranges you are looking for at a glance. If you are catching bass on a crankbait in ten feet of water, you can set the range to eight to twelve feet and quickly replicate your pattern in other areas.
Remove the Clutter
One tool that will eliminate clutter and speed up your electronics is adjusting what is shown on your screens. For instance, Lowrance allows you to show contours for all depths or modify it only to show contour lines for 60 feet or less. On deep lakes, this eliminates contour lines in areas where you don't plan to fish, and it also helps to speed up the unit's display as the map refreshes as you are speeding down the lake.
Make Your Maps
The list of lakes and rivers with electronic map data is incredibly long, but there is still the chance that your favorite fishing hole is not mapped or could be even better. The good news is that you can make your maps with your chart plotter.
All of the major electronics brands have their version of the feature. Navionics allows you to make your maps via their app and even on-screen with some electronics brands.
The benefits of making your maps are endless and can give you an edge over the fish. To learn how on your specific brand of electronics, there are countless tutorial videos on YouTube to help get you started.
Organize Your Waypoints
Many anglers will utilize GPS waypoints to navigate back to fishing areas, and they are an essential tool for that, but over time it can cause confusion with so many waypoints from your home waters. Was that waypoint a fish catch? Was it a big tree under the water? Was it a bed fish from several years ago? Often, it can be hard to keep track of what exactly was marked.
Most modern chart plotters will allow you to use symbols for the waypoint icon, which is a great way to keep organized. Using a rock symbol for a rockpile and a fish icon for a solid fish catch will help keep things separate and organized.
Coupled with your electronic mapping, you can get clues to where the fish are positioned with your electronic mapping. It is one more way to stay organized and put the puzzle pieces together.
Getting the most out of electronic mapping will take you to the next level in bass fishing. Starting with the basics of learning to read contours and then expanding to maximize your charts' effectiveness will help you quickly break down any body of water.