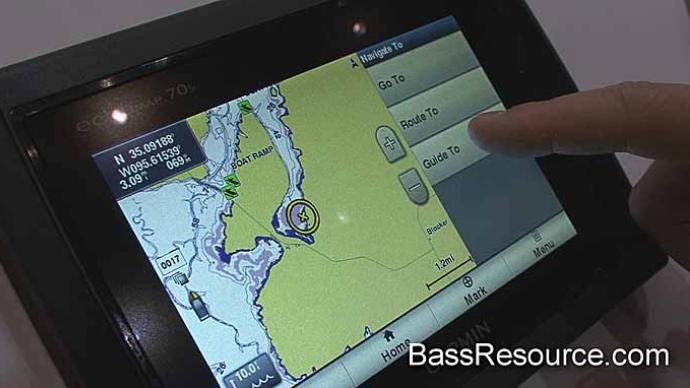
Maps come in all shapes and sizes and can tell the reader a fantastic variety of information, including population density, land use, locations of roads, cities, and natural areas, and even what the bottom of a pond looks like.
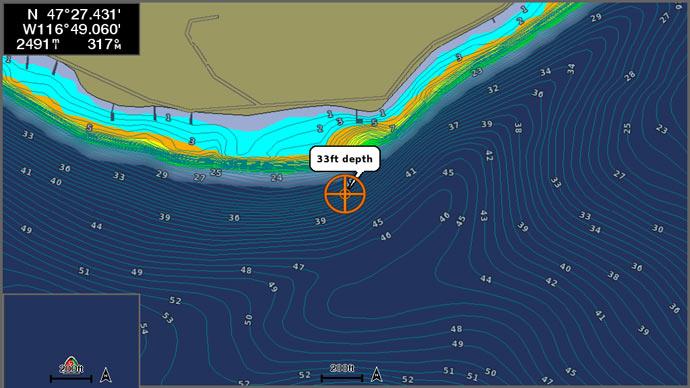
Bathymetric maps specifically tell the reader what the bottom of a body of water is shaped like, especially how deep the water is and where navigation hazards are, which can be helpful for fishing and navigation. A user can create a hypsographic curve from a bathymetric map to determine how much water is in the pond or lake.
Topographic maps show the physical characteristics of dry land; they tell the reader how tall mountains are, what the terrain looks like and where features (roads, ponds, houses) are located. Topographic maps are more common than bathymetric maps but are made in a similar style and focus on telling the user about the natural and physical features of the land.
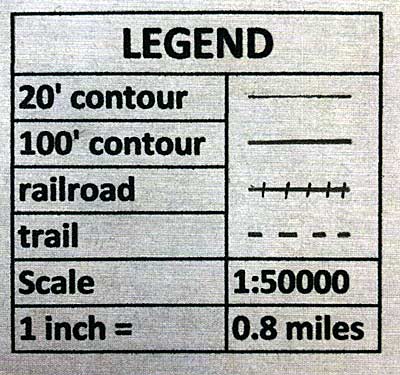
All maps have a critical feature called the legend, or key. The legend tells the user what each symbol on the map means and helps the user interpret information on the map. The more complex the map, the larger and more detailed the legend will be. Some maps will add the local declination, which shows the difference between true north and magnetic north for that location. True north is the north pole, where all the longitude lines meet at the top of a globe and where the imaginary axis that the earth rotates on is located. Magnetic north is where a compass points to, and this is not the same as true north, which can make navigating by compass and map just a bit complicated!
There is a small sample legend with a few features on this page.
Fun with math:
The sample legend shows the map scale is 1:50,000 and that 1 inch = 0.8 miles. The map scale means that anything on the map equals 50,000 of those things in real life (IRL). A trail that is one french-fry long on the map will be 50,000 french-fries long to hike. The legend also shows that 1 inch on the map equals 0.8 miles on the ground. We know that one inch on the map equals 50,000 inches in real life, so that must mean that 50,000 inches equal 0.8 miles! Right? Does that make sense? Check it out!
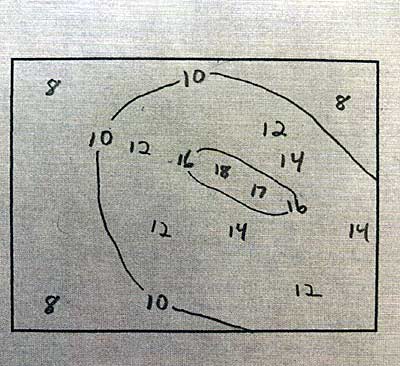
Topographic and bathymetric maps use contour lines to tell the user the elevation of the land and the depth of water. Contour lines are a type of isoline, which is a line that connects only points of equal value.
Therefore, a contour line connects only points of the same elevation or depth; no other elevations or depths are allowed to be included in that contour line. Weather maps are another map you often see that isolines connecting temperature or atmospheric pressures help show and predict the weather. As you might imagine, building an isoline map is a bit of a puzzle. I've started (and finished as a key) an example isoline map. Try to finish the started one and see if you can solve the puzzle as I did.
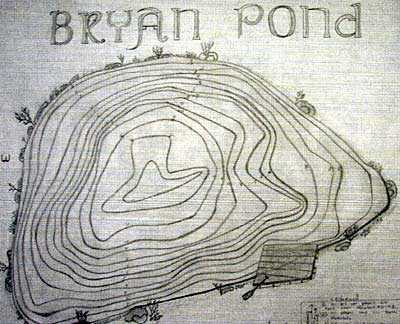
The isoline sample you tried has a contour interval of 2; each line is two units apart. Imagine that the units are in feet, and the lines represent the depth of a pond on a bathymetric map. How deep is the deepest point of the pond? 18 feet, right? Notice that the lines are closer together in some spots and farther apart in other sections. When the contour lines are close together, the depth of the pond changes very quickly, or the banks of the pond are steep. When the changes in depth are far apart, the bottom of the pond is more flat than steep. This is called gradient, a number determined by dividing the change in depth by the distance traveled.
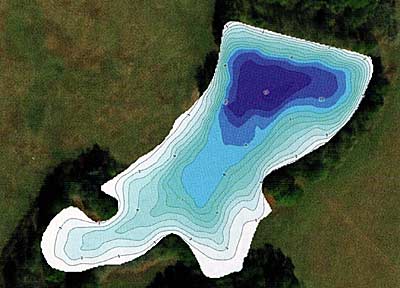
Bathymetric and contour maps let the user visualize the gradient without knowing the actual value of the gradient. There is a sample bathymetric map for you to look at; try to imagine what the bottom of the pond looks like.
Contour maps are more common than bathymetric maps. Users can explore maps that describe the physical world in 2-dimensions (flat) by using an app like "ALLTRAILS" by finding an excellent topographic map of a local natural area or buying or borrowing some USGS topographic quadrant maps. The ALLTRAIL app is free and has a topographic layer that can be added to the map that allows the user to scan and zoom to other nearby areas. The "Adirondack Paddler's Map North" is an example of a specialized and excellent map of the New York State Adirondack Park that is found in this area.
Here are a few questions you might try to answer while exploring a map. Do contour lines point upstream (to the source) or downstream? What unique symbol indicates a depression or hole on an otherwise raised surface? Can you find steep or flat areas near you and the ground truth of your hypothesis? How many legend symbols can you commit to memory, as most are universal (the same on every map)?
Enjoy - maps are FUN!!!
Christine Cornwell is a horse trainer who lives in upstate New York with her husband and son. She has worked for the New York State Department of Environmental Conservation and was a high school science teacher. Sharing her love of a healthy, natural world is a daily passion.
Reprinted with permission from Pond Boss Magazine
